
The hidden cost of digital friction (and why most organizations never measure it)



If 60% of employees lose at least half a day every week fixing fragmented systems, why does it not show up on any dashboard?
It’s one of those stats that should stop a room. Because if that time were visible, it would be treated like a crisis.
Half a day per employee, every week. That’s not a rounding error, that is a structural failure. And yet, it rarely makes the boardroom agenda.
Why? Because digital friction is one of the few costs in a business that everyone feels… and no one owns.
💡Read: The State of the Employee Experience 2026
.png)
Digital friction isn’t a UX issue. It’s a system tax.
Let’s clear something up quickly.
Digital friction is not:
- slightly annoying tools
- clunky interfaces
- minor inefficiencies
It’s a system-wide tax on getting work done.
The latest State of the Employee experience report shows:
- 67.5% of employees have to switch between multiple tools to complete a single task
- 60% lose at least half a day a week fixing fragmented systems
- 28.3% have considered leaving because of poor workplace tools
If this were a supply chain issue, it would be escalated immediately. But because it lives inside knowledge work, it gets labeled as “just how things are.”
The real story isn’t the tools. It’s the workday.
Most organizations think in terms of tools. Employees think in terms of a workday. And those two perspectives are completely misaligned.
On paper, the digital workplace looks fine:
- Tools exist
- Systems are live
- Adoption is high
In reality, the workday looks like this:
- Start a task
- Bounce between tools
- Hunt for context
- Rebuild understanding
- Patch gaps
- Repeat
Not broken enough to fail. Just broken enough to slow everything down.
That’s the danger.
💡Read: How the digital workplace broke down
Three drains that quietly redefine productivity
Digital friction doesn’t show up as a single point of failure. It leaks out across thousands of small interactions.
1. Switching becomes the default mode of work
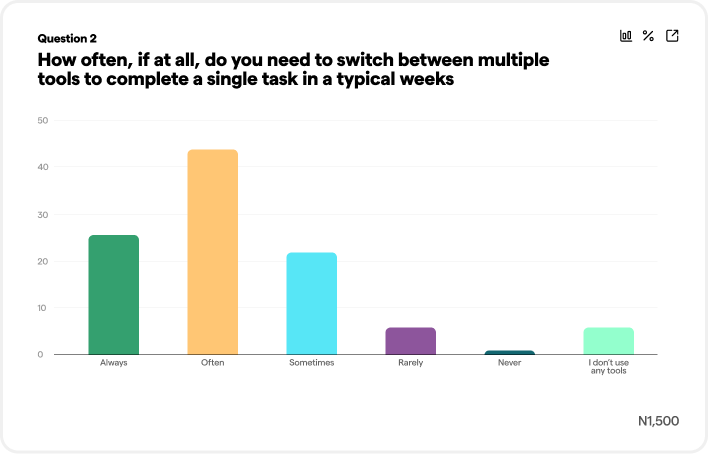
When 67.5% of employees have to switch tools to complete a task, switching stops being a disruption. It becomes the workflow.
Every switch forces people to:
- pause
- remember context
- rebuild momentum
The State of the Employee Experience report highlights that even a few minutes to refocus adds up fast. Some studies say up to 23 minutes.
Now multiply that across:
- multiple switches per task
- multiple tasks per day
- entire teams
What looks like “normal collaboration” is actually a constant reset loop.
💡 Read: How fragmented tools are hurting your team
2. Searching becomes a second job
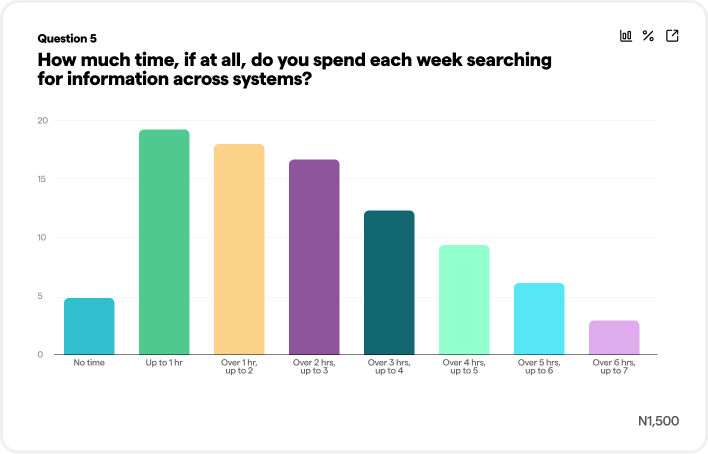
The report shows large portions of employees are spending 1–3 hours every week searching for information.
And it creates a vicious cycle:
- Can’t find it → recreate it
- Unsure if it’s current → double check
- Don’t trust the system → ask someone
Which leads to:
- Duplication
- Delays
- Dependency on people instead of systems
That searching results in both time land confidence lost, not mentioning the frustration it brings on a regular basis.
3. Glue work keeps everything from falling apart
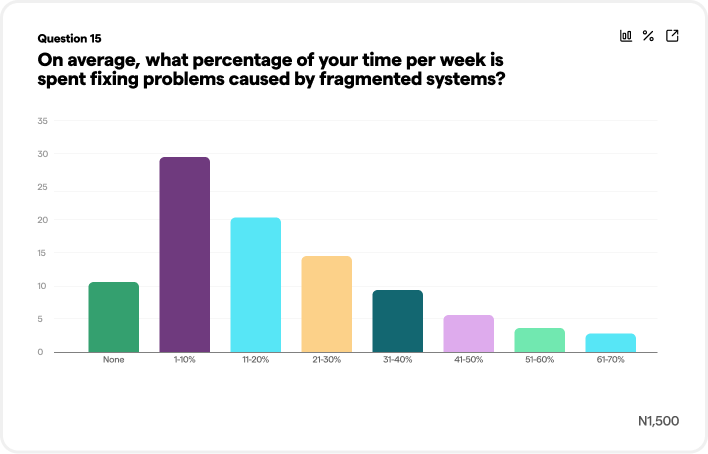
This is the part most organizations underestimate.
When systems don’t connect, people step in. Not because they’re told to. Because they have to.
Our data shows:
- Only 10.3% spend no time fixing system issues
- The majority spend a meaningful portion of their week doing it
- ~60% lose at least half a day
- ~15% lose a full day
What’s interesting isn’t just the time. It’s what that time represents.
Glue work is:
- translating between tools
- aligning fragmented information
- keeping work moving despite the system
It’s effort that shouldn’t exist… but has become essential.
Why this never shows up in leadership reporting
This is where things get uncomfortable. Digital friction isn’t invisible by accident, it’s invisible by design.
Because most metrics track:
- whether tools are used
- not whether they work together
They track:
- access
- not effort
They track:
- output
- not the cost of producing it
So the picture looks healthy:
- adoption is high
- systems are live
- usage is stable
Meanwhile, underneath:
- attention is fragmented
- time is leaking
- energy is being drained
This is the metric gap. Adoption metrics tell you if tools exist. They do not tell you if work is efficient.
💡Read: How to boost adoption of your tools
Why do we accept digital friction?
Here’s where it gets slightly uncomfortable (in a useful way). We wouldn’t accept this anywhere else.
You wouldn’t tolerate:
- a website where customers have to check five pages to complete one action
- a checkout process that requires switching tools
- a support journey built on guesswork
But internally, we call it “good enough.” Simply because employees adapt.
They remember where things live, create workarounds, absorb the friction, but each of these coping mechanisms brings its own challenge.
A simple model to make friction visible
If organizations want to measure digital friction, they need to stop looking at systems and start looking at experience.
A practical way to do that:
1. Time
- How much time is spent fixing systems or searching?
- (your data already answers this… and it’s not small)
2. Attention
- How often do tasks require switching?
- (67.5% say “often” or “always”)
3. Confidence
- Do people know where to find things?
- Or are they relying on memory and guesswork?
4. Rework
- How often is work duplicated or revisited because context was missing?
None of these require new tools, they just require asking better questions.
Erosion of employee experience
This is where digital friction becomes a leadership problem.
Not because it hurts productivity (it does). But because it changes how work feels.
When friction is high, effort increases, progress slows, satisfaction drops. And over time, frustration builds, engagement falls, attrition risk rises.
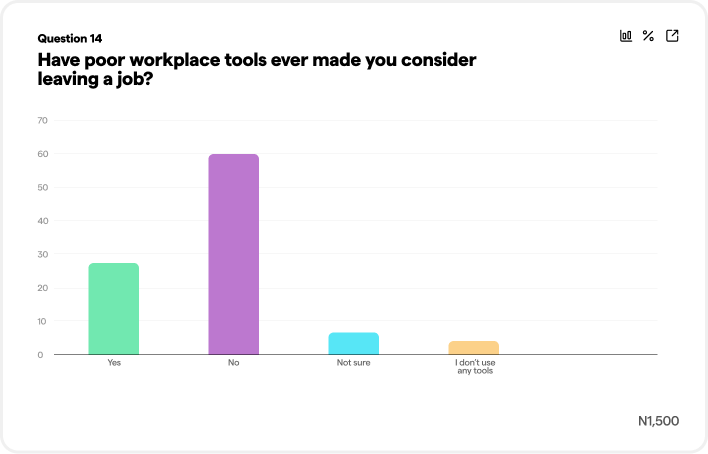
The stat says it clearly:
28.3% of employees have considered leaving because of poor workplace tools.
That is an experience problem.
💡Read: How to stop losing your best employees
First fixes: fight the instinct to add more
Most organizations respond to friction the same way:
Add something.
- another tool
- another channel
- another layer (often AI now)
This is called additive bias, and we’re all guilty of it. It’s also the fastest way to make things worse.
The better approach is uncomfortable, but effective:
Remove duplication
- Fewer tools doing the same job
- Clear decisions on what stays and what goes
Clarify where things live
- One place for each type of information
- Clear ownership
Reduce places to check
- Fewer channels
- Fewer notification loops
- Fewer decisions about “where next”
In short: make work easier to navigate, not richer in options
Final thought: the cost isn’t hidden anymore
For a long time, digital friction has been tolerated because it felt manageable.
It isn’t anymore.
Haiilo data shows the scale, the frequency, and the impact on retention. The real risk now is that organizations keep accepting it anyway.
Want to see how you compare?
This piece only scratches the surface. The full picture is in the latest State of the Employee Experience 2026.
Download today to:
- Benchmark your organization against 1,500 employees in the UK and US
- Understand where digital friction is hitting hardest
- Identify the biggest opportunities to reduce productivity loss
Digital friction FAQs
Digital friction is the extra effort employees spend navigating disconnected tools, systems, and processes at work. It goes far beyond slow software or a poor user experience. It includes switching between apps, searching for information, recreating work, and filling gaps between systems that don't communicate effectively. While these issues may seem minor on their own, together they create a significant drain on productivity, focus, and employee experience.
Most organizations track technology adoption, login rates, and platform usage. What they rarely measure is the effort required to get work done across multiple systems. As a result, leaders can see that tools are being used but not how much time, attention, and energy employees are losing in the process. The cost remains hidden because traditional workplace metrics focus on activity rather than efficiency.
Digital friction affects productivity in several ways. Employees lose time switching between applications, searching for information, chasing context, and fixing issues caused by fragmented systems. According to the State of the Employee Experience 2026 report, 60% of employees lose at least half a day every week dealing with disconnected tools and processes. That time adds up quickly across teams and can significantly reduce the capacity available for strategic, high-value work.
Absolutely. Poor workplace technology doesn't just reduce productivity, it shapes how employees feel about work. When people regularly encounter unnecessary obstacles, frustration increases and engagement declines. The report found that 28.3% of employees have considered leaving their organization because of poor workplace tools and systems.
The best place to start is by simplifying, not adding. Reduce overlapping tools, establish clear ownership of information, create a single source of truth where possible, and minimize unnecessary channels and workflows. Measuring time lost, task switching, information confidence, and rework can help organizations identify and remove the biggest sources of friction.

State of the Employee Experience 2026
Read the research in full
Find
your
flow
Bring communication, knowledge, and tools into one calm place — and help your people find their flow.